Several researchers and engineers from GIP RECLUS (notably Patrick Brossier, Christian Carrié and Patricia Cicille) have produced this Interactive Atlas of Vietnam.
This digital version is a complement to the paper version of the Atlas of Vietnam, published by Documentation Française and RECLUS under direction of Christian Taillard et Vû Tu Lâp.
Choroscope® software package: objectives and principles
Like any other atlas, Choroscope® provides information, i.e. analysed data, highlighting the major characteristics of the phenomena under scrutiny and pointing to essential features.
The basic principle is to help the user visualise maps associated with one or several parameters that he wishes to study.
It should be noted however that Choroscope is not cartography software: it only displays existing maps thus enabling non-specialists to visualise data that have been analysed by specialists.
As the structure of computer cartography software data has been retained both in the basemaps and in the statistical data matrix, many possibilities for exploration are offered to users who are not themselves cartographers but who may nevertheless find step-by-step answers to their queries. This interactive element should enable decision-makers to make territory analysis part of their development strategies.
This will also provide teachers at all levels with a valuable teaching tool to demonstrate the need for spatial representation of economic information.
RECLUS Interactive Atlases are based on the Choroscope® software package (from the Greek khora, country, and skopein, to examine).
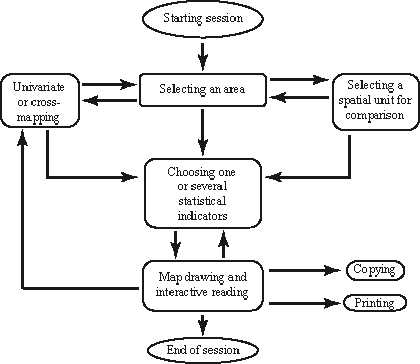
First load the software, then select an area. Choose one indicator (simple mapping) or several (cross-mapping). The names of spatial units can be displayed on the map. It is then possible to proceed further by selecting one spatial unit for comparison. The following steps consist of choosing other spatial units, other indicators or other areas to be compared.
Choroscope® proposes two methods for exploring maps: simple mapping and cross-mapping, with the added facility of map analysis by comparison with a given spatial reference unit.
1. Simple mapping
This aims at solving the usual problem of the spatial distribution of one particular phenomenon (as measured by one indicator). The major features of this particular distribution are thus highlighted.
There are two methods for representing the frequency of a particular phenomenon:
colour shading (choropleth maps) to show ratios such as percentages. In this case spatial units are in different colours, each colour expressing a class of values;
circles (symbol map) to show classes of numbers for each spatial unit.
2. Cross-mapping
This method is designed to answer questions concerning the links between several indicators.
2.1. Simple crossing
Maps representing two indicators may be visualised: the aim is either to approach phenomena in terms of their development or to identify similarities between phenomena.
In the first case one of the indicators describes a phenomenon in terms of numbers at one given time, while the other shows a ratio. The resulting map has proportional coloured circles, each circle representing numbers and the colour the associated class of values.
In the second case, two phenomena are analysed in terms of their importance. Indicators represent numbers. Maps therefore show semi-circles, each of these corresponding to the number attached to either of the two indicators.
2.2. Complex cross-referencing
Choroscope® makes it possible to make complex cross-references, based on the congruency of spatial phenomena. As the user can select one or several categories for several (2 to 4) indicators he is then able to visualise the frequency of simultaneous occurrences.
3. Comparison between spatial units
Choroscope® performs the following functions:
locates all spatial units similar to one particular unit selected as a reference;
finds all spatial units with one particular chacteristic.
The aim is to identify areas presenting similarities. This means that one common method of thematic map browsing - division into classes - is used systematically.
Starting from WINDOWS, double-click on the Choroscope® icon.
If the programme has not been installed as part of a group, go to CHOROVN directory (File manager) and double-click vchorovn.exe to start the application.
From the File menu, choose Open.
When a dialogue box is displayed, select vieteng.ini.
Once you have selected vieteng.ini, the Vietnam:theme (1) window is displayed on the screen. You should then select the theme you wish to explore by clicking its title.
Window (1) is iconised: two windows are then displayed showing the titles of the chosen theme. Window (2) gives access to the indicators of the theme, window (3) displays the basemap associated to the theme.
Click the chosen indicator, window (4) displays the associated legend.
To visualise the map, click window (3), you will then see the chosen map.
If the "comment" option is ticked, an additional Comment (5), window opens, associated with the map displayed. This window shows the name of the indicator, the title of the variable mapped and the page number in the Atlas where the map is analysed.
For univariate class-crossing, repeat stages 4 and 5.
To display names, use command Names from the Option menu. The names selected in window (6) are then displayed on the map. However, by clicking in window Map (3) one spatial unit with the left-hand mouse button, you can display its name. To delete it, click the same unit with left-hand button.
An example of simple mapping
Associated icons
Simple crossing: map with coloured circles
This map results from the cross-referencing of two variables, one representing population groups, the other a ratio (see 2.1. Simple crossing).
Simple crossing: map with coloured semi-circles
This map results from the simultaneous representation of two variables representing population groups (see 2.1. Simple crossing).
As in the Atlas, the maps of Choroscope® are classified into chapters, called "Themes". If you wish to cross-reference maps classified under different themes, simply use the Theme cross-reference command in the Option menu.
Repeat stages 2 and 3 (p. 10) as many times as you require indicators. There should be the same number of Indicator and Map windows open as repetitions of stages 2 to 3. Warning: you will only be able to do cross-referencing if the basemaps associated with the chosen themes are identical!
Choose option Theme cross-reference. The Map windows corresponding to the chosen themes are then displayed as icons and a Theme cross-reference window are displayed.
In order to select the indicators you wish to cross, press crtl key and, holding this down, click the chosen indicator: the pointer then changes into a cross. Drag the chosen parameter into the Theme cross-reference window. Repeat operation as many times as necessary.
To visualise a simultaneous representation, proceed as in the case of simple crossing while choosing the parameters you wish to map from the Theme cross-reference window.
In order to help you choose cross-references, the vnliste.wri file contains the list of all indicators for each area. This can be edited (under Write) and printed.
Theme cross-referencing
This map has been obtained by theme cross-referencing representing a) population groups and b) a ratio. Note: the map is displayed in a Theme cross-reference window.
The geographical units of Choroscope® are nested at two levels. Exploration can therefore be detailed to the level of a specific sub-area.
To do this, click the Map window with the right-hand mouse button (outside basemap). The window then displays a list of sub-areas click the one you want to display the map for the chosen area. To return to the general map, choose Overview option.
To find the answers to questions such as: "In which provinces do we find a low rate of economic activity coupled with a high rate of unemployment?":
in order to display similar spatial units, select 2, 3 or 4 indicators expressing ratios;
in order only to retain the classes chosen, deselect all others by clicking the coloured boxes in the legend;
click the Map window. The only spatial units displayed in colour are those in the classes chosen (OR operator) for the criteria selected (AND operator).
To answer the following question: "Which provinces have rates of activity and unemployment similar to those of this or that province?", simply press crtl key and click the relevant area while holding down crtl key.
Choroscope® enables users to select page settings (in A4 format) of maps for printing.
Activate the New layout command in File menu: a Layout window is displayed.
Inside this window dialogue boxes (1) open, associated with titles (2) displayed below. When you click one of the titles, the corresponding box is highlighted, or vice versa. You can move the boxes with the mouse (click and drag) or with the keyboard pointers.
Zooming a document in and out:
- with the mouse: position the cursor at the centre of the box, hold down crtl key and move cursor;
- with the pointers, holding down crtl or alt key, according to the position and size of the box.
You can then visualise the resulting image by using the Visualise command in the File menu. Warning: the result depends on the size of the boxes and on the size of windows as displayed on screen. You can change either or both.
Click the Visualisation window to activate it. You can return at any time to the Layout window: in order to activate it, hold down alt key and click the window.
To cancel the Comment element, select it and press the Cancel command.
You can add a text (e.g. a title) to the map with the Add text command in the Edition menu.
In order to assist you with map layouts, an example is shown here: use Load command in File menu.
Four models have been used to provide an overview of the major patterns of Vietnam. The first of these is the dichotomy between highlands on the one hand and the two Deltas and the groups of islands on the other. The second model highlights the uneven distribution of population and the sharp differences between North and South. The third basic model identifies the meridional axis and gateways, the backbone of the country. The fourth reproduces the dynamics of the urban systems on which Vietnam's spatial organisation rests, with the inner orbital pattern and successive peripheral areas.


![[Screen]](/images/Choro/Chor08_eng.jpeg)
![[Screen]](/images/Choro/Chor10_eng.jpeg)
![[Screen]](/images/Choro/Chor141_eng.jpeg)
![[Screen]](/images/Choro/Chor142_eng.jpeg)
![[Screen]](/images/Choro/Chor15_eng.jpeg)
![[Screen]](/images/Choro/Chor16_eng.jpeg)
![[Screen]](/images/Choro/Chor18_eng.jpeg)
![[Screen]](/images/Choro/Chor19_eng.jpeg)
![[Screen]](/images/Choro/Chor20_eng.jpeg)
![[Screen]](/images/Choro/Chor23_eng.jpeg)
![[Screen]](/images/Choro/Chor24_eng.jpeg)